Quick monitoring script for commandline using google graph
So, you need to setup a graph for something you maintain, for instance response time of a webserver, memory consumption of some process or open database handles. Fast.
You could use MRTG, if you've got it already running. But either way - to add a new graph there isn't really done fast. And what if you don't have MRTG? What about GNU Plot or Google Graph? Every tool like this needs handwork to be done before being able to produce usefull output. One needs more than the other.
Enter quickmon. This is a small script I wrote for the very purpose. It doesn't have any dependencies and therefore runs out-of-the-box. You supply it one or more shell commands and it generates a google graph page and a logfile where it maintains history. It is really not possible to create monitoring graphs any faster!
And as a plus, the tool itself doesn't require internet access. It can run anywhere, inside some protected DMZ or the like. Only the browser which is used to view the output page needs internet access to fetch the google graph JS-library. That's it.
So, first of all, grab a copy of the script from here.
Now, let's take a look at some examples:
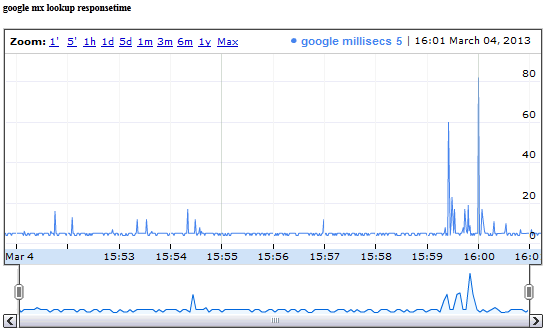
quickmon.pl -n "google mx lookup responsetime" \
            -t "google millisecs" \
            -c "host -v -t MX google.com 8.8.8.8 | grep Received | awk '{print \$7}'" \
            -l
In this example we monitor the response time of googles nameserver (when asked for its mx-record) in milliseconds. As you can see, there's one -t and one matching -c parameter. -t tells us what we are actually monitoring and -c is the shell command to be executed. In this example we're using host -v which prints the responsetime of a query in milliseconds. We fetch this value using the grep + awk after the pipe. Here's the output:
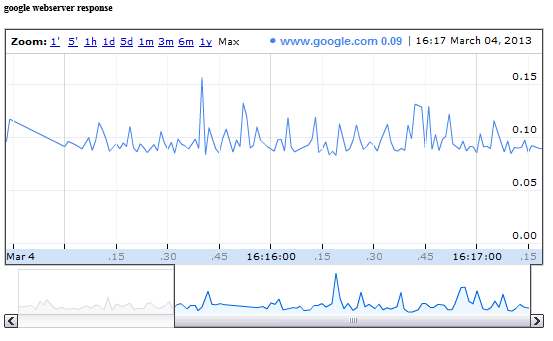
Here's another example:
quickmon.pl -n "google webserver response" \
            -t "www.google.com" \
            -c "wget -4 -q -O /dev/null www.google.com" \
            -l
Note the difference to the previous one: we didn't put some grep + awk parser stuff into our shell command. If you do that, the script measures the time it takes to execute the command itself.
This is how it looks after some time:
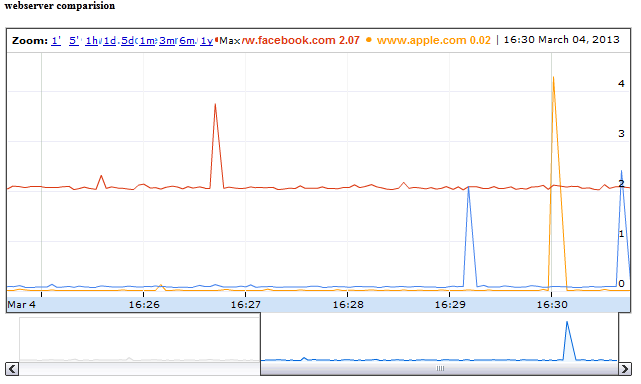
How about having multiple items in a graph? No problem, you can pass multiple -t and -c parameters to the script. However, be careful to have always one -t for every -c. And: order matters.
quickmon.pl -n "webserver comparision" \
            -t "www.google.com"     -c "wget -4 -q -O /dev/null www.google.com" \
            -t "www.facebook.com"   -c "wget -4 -q -O /dev/null www.facebook.com" \
            -t "www.apple.com"      -c "wget -4 -q -O /dev/null www.apple.com" \
            -l
Ok, quite a long commandline. Watch the matching -t and -c parameters. And here's the output:
One last thing: You might have noticed the -l flag. If supplied, the script runs forever and executes the given commands once every second. That's enough for some quick graphing but sometimes you might need to create graphs for longer timescales, say some days or weeks. In such cases running once per second might be overkill. And executed this way, the script doesn't survive reboots. In such cases just add a cronjob, which executes the quickmon.pl script once every 5 minutes (or whatever you like) and leave the -l parameter. Example:
*/5 * * * * cd /home/user/tmp/ && /usr/local/bin/quickmon.pl -t "title" -c "command"
Beware the chdir call: quickmon.pl uses the current directory to write its logfile and the output page (index.html).
In case you want to take a look at a live sample, here you go: it is the webserver comparision described above, run every 5 minutes by cron.
Well. While this all might sound very cool, there's still one usecase where quickmon.pl could be too complicated. Let's recall: for every painted line in the output graph you have to provide a shell command which returns its value. What if you already have a source which returns such values all at once? Given the examples above it might look like we have to provide one -c parameter per value but each command has to split the same input source differently. That's odd. To say the least.
Take a look at this command output:
$ netstat -w 1 -I bge0 -q 1
            input         (bge0)           output
   packets  errs idrops      bytes    packets  errs      bytes colls
         9     0     0        828          8     0       9108     0
We've entered the netstat command which printed some stats about a specific network interface. Wouldn't it be good to feed quickmon directly with that output? The good news is: it's possible! Here's a quickmon call which catches some of those values - in and out bytes - to generate a graph from it:
while :; do netstat -w 1 -I bge0 -q 1 | egrep -v "(input|packets)"; done \
     | quickmon.pl -t in-bytes -t out-bytes -p -n bge0 -f 3,6
There's a lot new stuff here, let's dig into it:
- We're calling the netstat command inside an infinite while loop, because otherwise it doesn't print to stdout but to our controlling terminal (which quickmon doesn't catch). This is freebsd specific. Behavior maybe different on other OSes.
- The egrep filters out the headings.
- We provide only 2 titles using -t, because we catch only field #3 and #6 (count starts from 0) by using the -f option.
- Option -p tells quickmon to watch a file. Since we didn't specify a filename, it uses STDIN, which is actually the output of our while loop.
And this is the output of the above after a while:
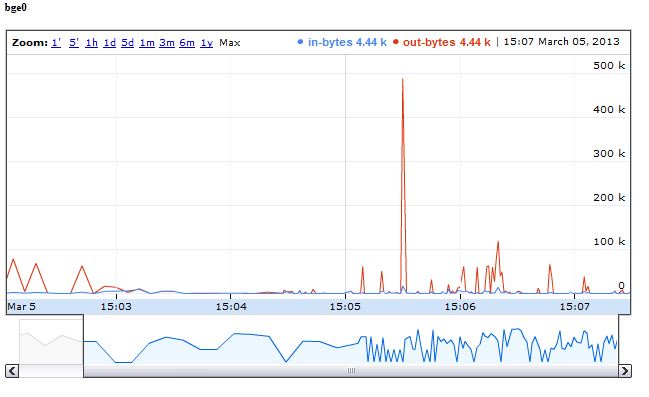
Nice, isn't it?
By default quickmon splits the input using whitespace. You might alter this behavior by supplying a different field-separator using the -F option.
Update 2015-10-18:
The script is now available on Github. The switch -l now has an optional parameter, the time in seconds to wait between loops, a float (i.e. .1 or 2.5 would be legal)Also, in pipe mode (-p) it's now possible to specify one title with a timestamp using format characters. So if your input file already contains a timestamp you can use that instead of generated ones.